I don’t think the curve actualy looks like that. There’s a shit ton of stupid people. I think it’s more like a line starting high on the left with low IQ and trending downward to the right and higher IQ.
the curve is ordinal, meaning that most people (68% of people) will score 85-115, give or take 15 - meaning if you take the test 3 times and get 100, 93.and 107… you can consider them all roughly the same score.
That’s because most people wouldn’t struggle with:
[xooo] [oxoo] [ooxo] what comes next?
[oxox] [xoxo] [ooox] [xxxo]
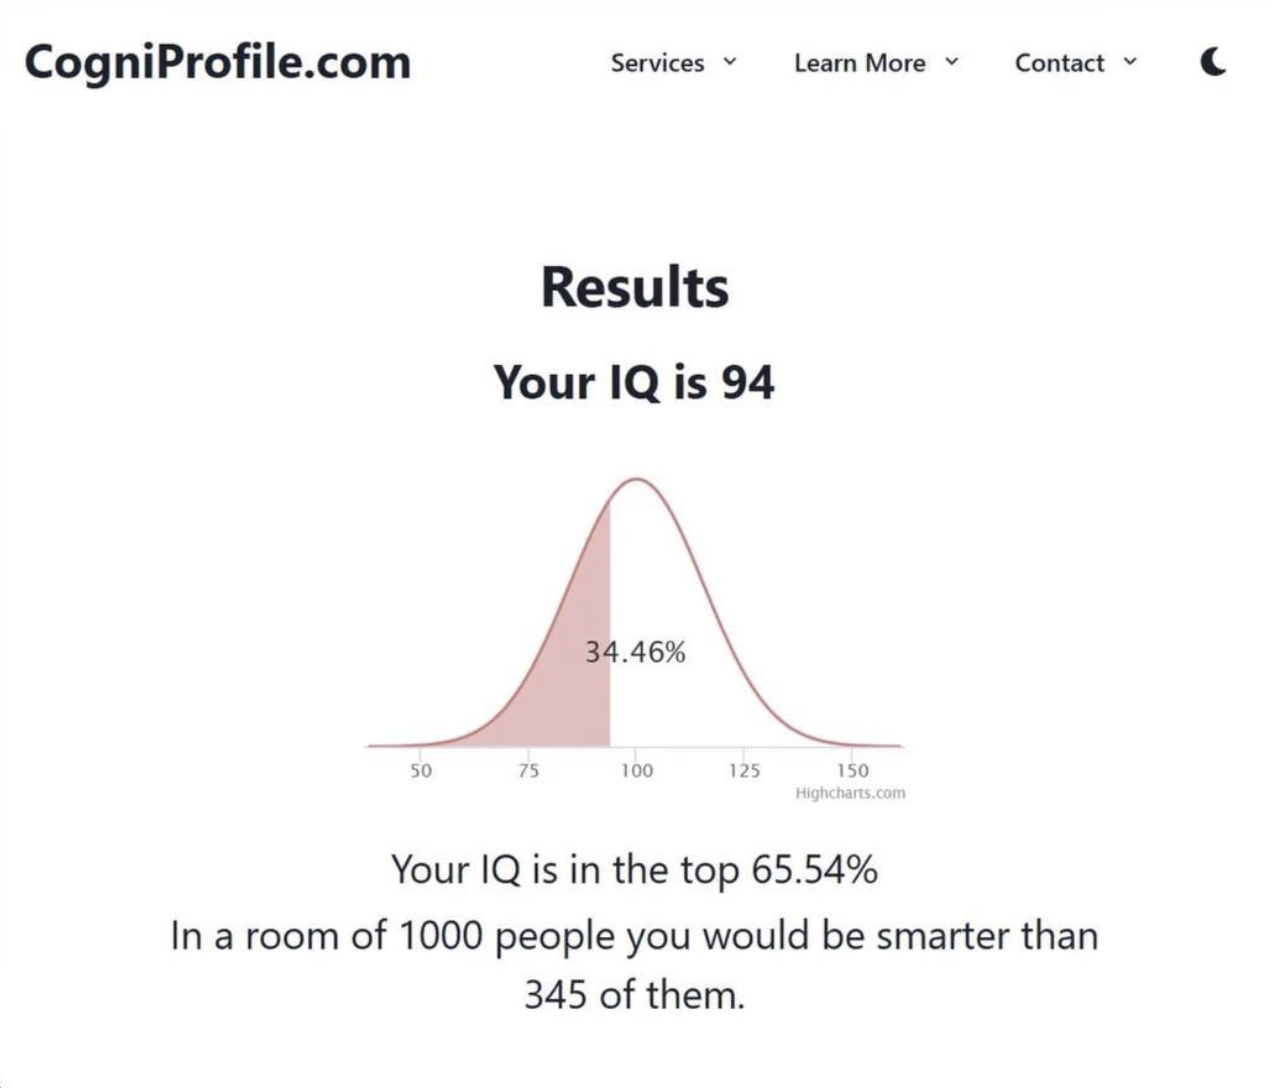
It seems that IQ tests are always used with a normal distribution.
I don’t know whether IQ/intelligence is actually normally distributed, but it seems that IQ test results are.
To find a graph that better matches what you described, you might be interested in https://en.wikipedia.org/wiki/Cumulative_distribution_function and/or https://en.wikipedia.org/wiki/Skewness