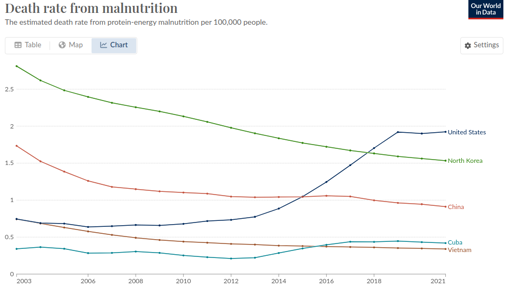
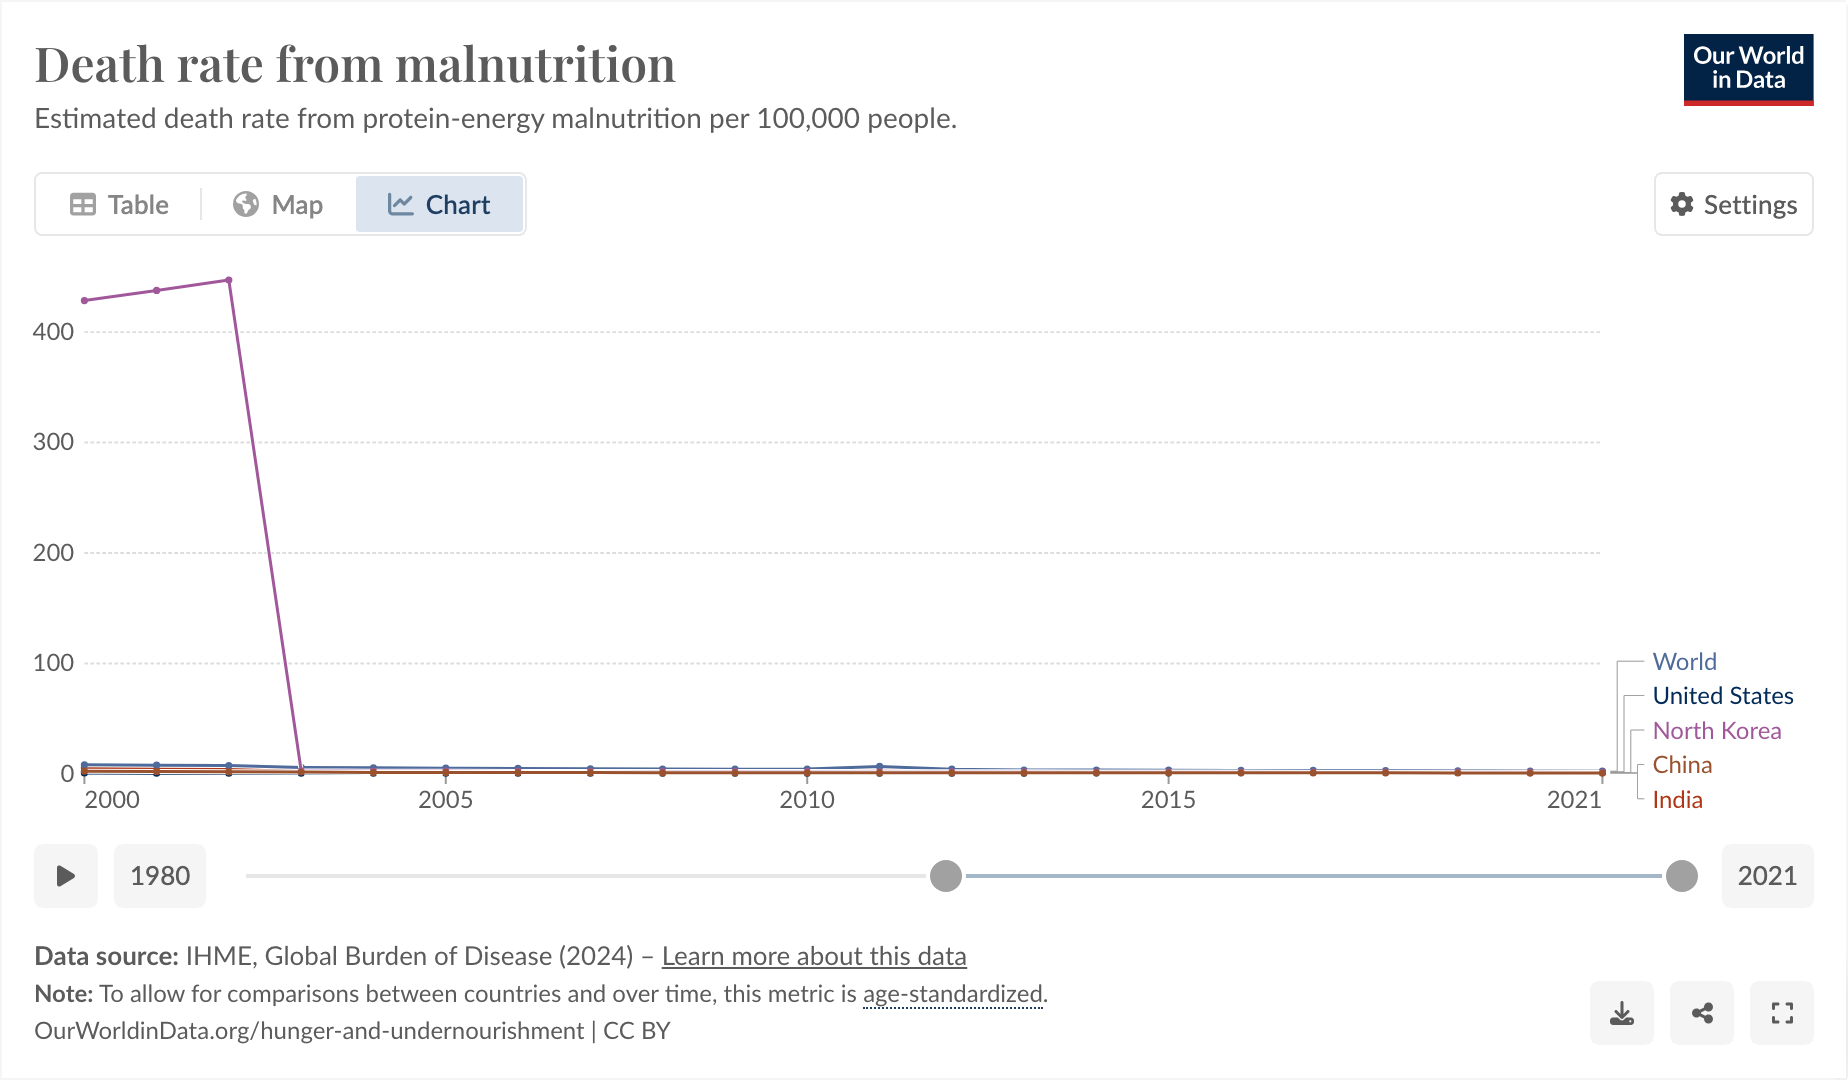
This is a weird one. Bear with me. From !dataisbeautiful@lemmygrad.ml:

So I said to myself, “that’s a little bit weird. The US one going up, I can actually believe, but the North Korea one being lower is definitely wrong.”
I think Our World In Data is just being shoddy, as they often do.
https://www.wfp.org/countries/democratic-peoples-republic-korea
The thing I found funny, and why I’m posting here, comes from observing why it was that they started their graph at 2003 and exactly at 2003.

I feel like you could use this as a slide in a little seminar in “how to curate your data until it matches your conclusion, instead of the other way around.”
And also, I don’t think the hunger rate suddenly dropped from epic to 0 exactly in 2003, I think more likely Our World in Data is just a little bit shoddy about their data.


They did. My parents had better lives in the few years before they left, compared to when they were a kid during the Mao era. Still was not a great life, and thats why they took me and my brother and we all left.
People defend a dictatorship and say “Quality of Lifr improved”. Well I mean, yea, thats to be expected as time goes on, improvent in quality of life is a global trend in (almost) every country, whether Democratic or Authoritarian, Capitalist or “Socialist”. Its not the “Socialism” that made China better, it was the diplomacy that opened up international trade. It was the better leadership after Mao. Mao didn’t do shit for China, Deng Xiaoping was who really opened up China and improved people’s lives (not saying Deng Xiaoping was a saint or anything, just stating facts). The “Socialism with Chinese Characteristics” was just his excuse, since he cant just be brutally honest and call it what it is, Capitalism (with tighter state control).