

- cross-posted to:
- memes@lemmy.ml
- cross-posted to:
- memes@lemmy.ml
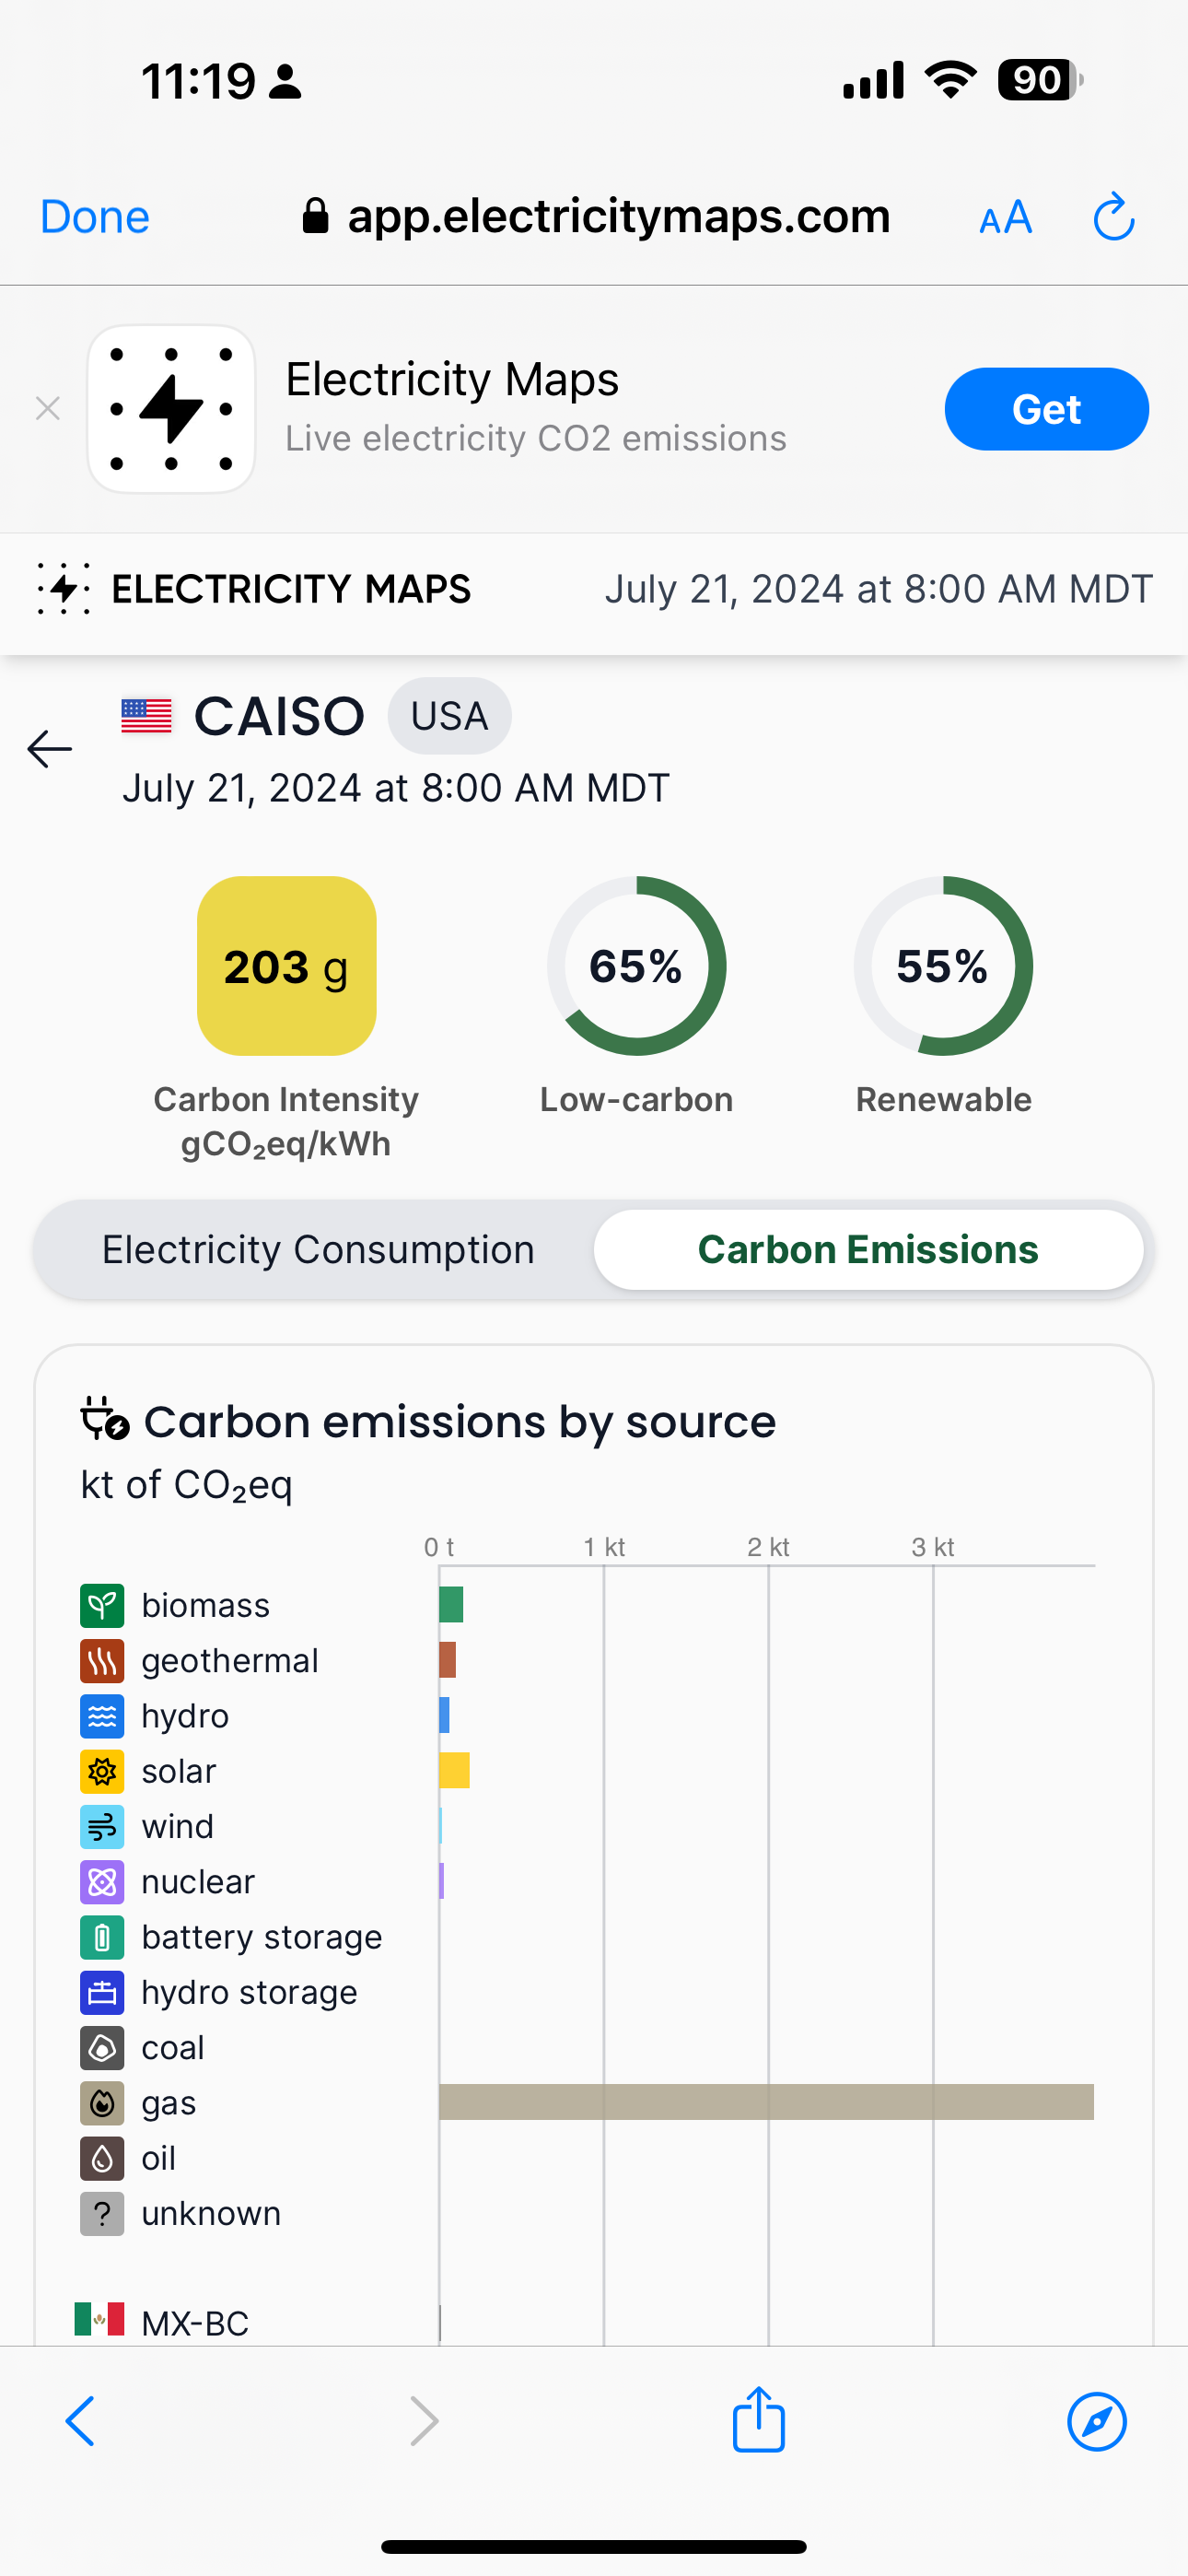
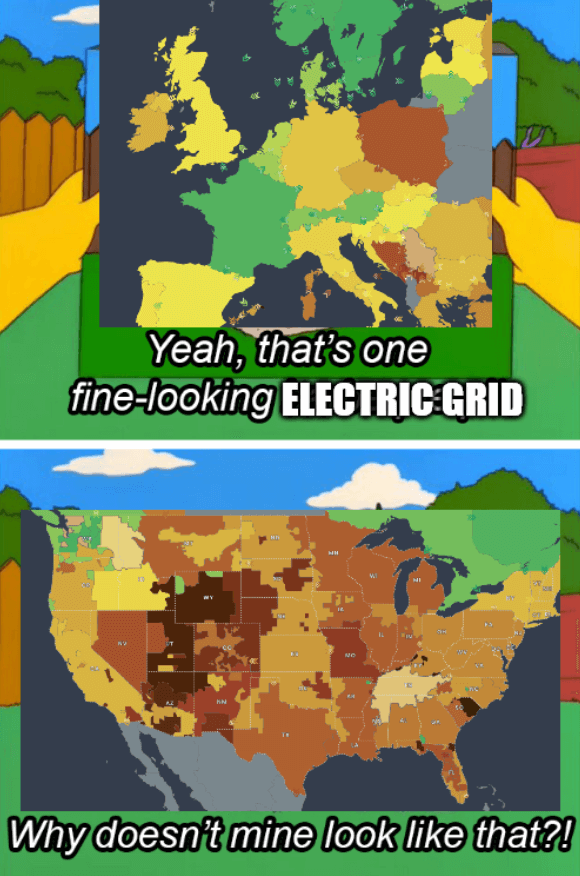
Source - The colors of the grids represent CO2 emissions
The title is a reference to the 2021 Texas power crisis
You must log in or register to comment.
France is so low thanks to all those nuclear power plants they have.
💪 Well they’re getting old now, that’s the not so fun part
Which are shitting themselves now. Unable to be properly repaired or financed. Requiring goverment bailouts
because they’re stupid and didn’t regulate them like they should’ve.
And im pretty sure france’s nuclear isn’t privately owned?
Not anymore, the government had to buy them fully so it wouldn’t crash.
Privatization of profits and nationalization of liabilities. It’s like France didn’t have many revolutions.
yeah that checks out.
Now if only they hadnt designed the horrid EPR plants.
Considering coal power plant subsidies in some countries…
These are not synchronous grids, but some other kind of boundaries. With synchronous grids the US should be split to only 3 zones, and most of Europe would be colored the same. So I think the kind of map you used is not the best for this joke.
World map of all synchronous grids:
.png)
From the website it sounds like that is a map of electric companies or something like that. So this map is not directly related to the Texas crisis. Most of these companies share electricity between each other.
Tom Scott video about synchronous grids: https://www.youtube.com/watch?v=bij-JjzCa7o
More info: https://en.wikipedia.org/wiki/Wide_area_synchronous_grid
I think the main point here is that it’s a map of CO2 production, not that the american electrical grid is split.
The part about the texas crisis made me think it’s about why the USA is not a single grid, while Europe is one.
Iirc one big reason made the crisis that severe was their grid is separate, so they couldn’t buy electricity from other states.
Also if that’s the case than using screenshots from that webside is quite misleading. That site uses live data, so if the 2 screenshots were taken at the same time, one of the continents was at night, so solar panels were not working… An avarege or aggregate map should be used, not live data
I’m not sure how it works in Europe, but power grids being privatized is a big issue in USA. It’s essentially a monopoly where one company owns and operates the grids in one or a few states. There’s no incentive to maintain the grid because there’s no competition and they receive government funding whenever a crisis like this occurs. It’s cheaper to just eat the fines than it is to buy electricity from neighboring states.
because there’s no competition
I think competition is not part of problem here. Privatization is.
Iirc one big reason made the crisis that severe was their grid is separate, so they couldn’t buy electricity from other states.
There was video on Practical Engieneering about this. They could and did until power line protection tripped.
Thanks for leading me down the electric grid rabbit hole!
I like how there is this giant Russian-Belorussian-Georgian-Azerbajanian-Kaxah-Uzbeki-Tajikistans-Kirgizian grid.
Who said something about USSA being “too big”?
The US eastern grid alone generates more than two times electricity than the former SU grid, and they are both dwarves compared to the chinese one. What do you mean, what is the point of your comment? Most of russia is just taiga forest, it’s big, but doesn’t need electricity.
Most of russia is just taiga forest, it’s big, but doesn’t need electricity.
There are lots of small cities and villages in that taiga. They require some wires anyway.
Similar argument can be made about US.
I don’t see how your post refutes his? Russia is big, but it’s sparsely populated, especially anywhere east of Moscow until you get to Vladivostok. Countries other than Russia in their grid equally if not more so sparsely populated. Top that with disparities in Quality of Life between the two grids, and you find the larger one using less power because it’s services less clients who use less electricity.
The current population density of U.S. in 2024 is 34.77 people per square kilometer
https://www.macrotrends.net/global-metrics/countries/USA/united-states/population-density
The current population density of Russia in 2024 is 8.42 people per square kilometer
https://www.macrotrends.net/global-metrics/countries/RUS/russia/population-density
Siberia is HUGE compared to anything.
Siberia is HUGE compared to anything.
Yes. And USA says “no, we are too big for unified grid and functioning railway, and density is soooo low”.
Who said something about USSA being “too big”?
We call this copium
Washington State checking in. They don’t call us “the evergreen state” for nothing!
All it took was sacrificing our river ecosystems and invalidating native tribes’ entire way of life
Texas tried that and we didn’t even get a functioning electrical grid.
We have a nuclear reactor in Puget Sound. It doesn’t provide much of our power though for some reason.
At least according to this it’s ~8% of the state’s electrical capacity all by it’s lonesome which doesn’t seem too bad. By the stats on it’s own wiki it’s pretty active.
I’ve heard there’s another reactor in the Willapa Hills that was constructed but never activated. Like some ghost story it still sits, unused, to this day.
Bangor got nuclear sub fleet, but the only functional reactor is the Hanford site in Richmond on the Columbia, as far as I know. Satsop site was cancelled with all the other reactors in Richmond.
When the global nuclear leader also has one of the cleanest grids but the climate lobby still says don’t build nuclear
The map is just bad? They’re throwing large groups of states together that have literally no control over what other states do. For instance, it groups part of North Dakota, Minnesota, Wisconsin, Iowa, and Illinois together as if they’re one giant blob and then saying they’re only 10% renewable and 31% “low carbon” (whatever that means).
A quick look at Illinois shows it’s 55% nuclear and 21.6% renewables for a grand total of 76% of their power being carbon free. Minnesota is 41% renewable, 25.3% nuclear, for a grand total of 66% carbon free electricity. Iowa is 90% (!!!) renewables. Even Wisconsin is 20% nuclear and 15.6% renewables.
https://www.eia.gov/state/data.php?sid=MN
https://www.eia.gov/state/data.php?sid=IL
https://www.eia.gov/state/data.php?sid=WI
https://www.eia.gov/state/data.php?sid=IA
However this map is being generated, it appears to be absolute garbage and intentionally skewed, and isn’t basing any of this on any logic. It can’t be based on population served or on size of ground covered.
what is it even trying to demonstrate? Doesn’t the US have three primary grids? The east, west, and texas?
Surely this is wrong? I guess the idea is to demonstate across state/country lines, but like, why? Who cares!
I believe it goes by county.
They’re based on the grid operators in these regions I think, but it still looks incorrect to me.
And Colorado has a significant amount of renewables as well so something is really off with the numbers here.
I also want to highlight Florida - which has around 10 different electric grids…
Someone much smarter than me can weigh in, but wouldn’t that be preferable in a place that could regularly see massive storms?
This way the whole state doesn’t lose power because a hurricane obliterated part of the state?
And I’m sure those grids must sell power between themselves when necessary.
This way the whole state doesn’t lose power because a hurricane obliterated part of the state?
That’s not how grids work. Hurricane doesn’t look at administrative borders.
The person above you is talking about the Texas power grid, which is lacking in redundancy and endurance. If Beryl had made landful along the Louisiana/Mississippi coast, for example, parts affect by the storm would certainly have lost power and those in adjacent areas. But towns 100-150 miles from the affected area would not have. In Texas, towns that didn’t even see wind or rain from the hurricane, much less any damage within their county, experienced blackouts because when one part of the grid fails, entire chunks of it just collapse in on themselves because they barely meet demand during normal conditions.
In other parts of the US when statewide blackouts happen from a single incident it usually involves massive state and federal level investigations that cost people their jobs and in some cases jail sentences, with revelations of how some key feature was outdated, improperly maintained or an oversight had it being the redundancy of several systems, and in rare cases corruption meaning the real world design doesn’t match the plans and submitted paperwork. These cases tend to be few and far between, once every 25 years if not less frequent, the last one that comes to mind being a power plant(in Ohio?) that went offline expectantly resulting in overloaded high voltage lines that had a very spicy interaction with nearby trees that caused a trip to cascade through the grid. And that was back in 2003.
In Texas the utility company examines itself, decides it didn’t do anything wrong, blames ‘extraordinary weather’ or similar circumstance that wasn’t just predictable but below the minimum standard the other two parts of the US grid grade themselves against while doing nothing to fix the problem, independent reporting usually revealing months or years later the fault point was something common, predictable and should not have been able to cascade throughout the region without redundant safeties present on other grids halting the spread and isolating that small local disturbance till it could be fixed by utility crews. These kind of faults have happened every year for the last 5 years. Sometimes multiple within the same year.
isn’t the entirety of the US split into two separate grids? East and west? And also texas, because they’re silly.
Like i’m pretty sure this is just, factually incorrect.
Sure but there are also regional divisions like on this map. There’s even connections between Texas and East and West grids, they’re not even totally separate
yeah regional divisions make sense, but i’m not sure why they would matter all that much, in the grand scheme of things it’s not exactly “my problem”
I wouldnt be surprised if they weren’t fully separate, from what i understand though, texas has a pretty much isolated grid since that allows them to get around federal regulations for power production. And the east and west would more than likely be a systems scale thing, it’s just better to have it split down the middle. Considering how few people generally live there.
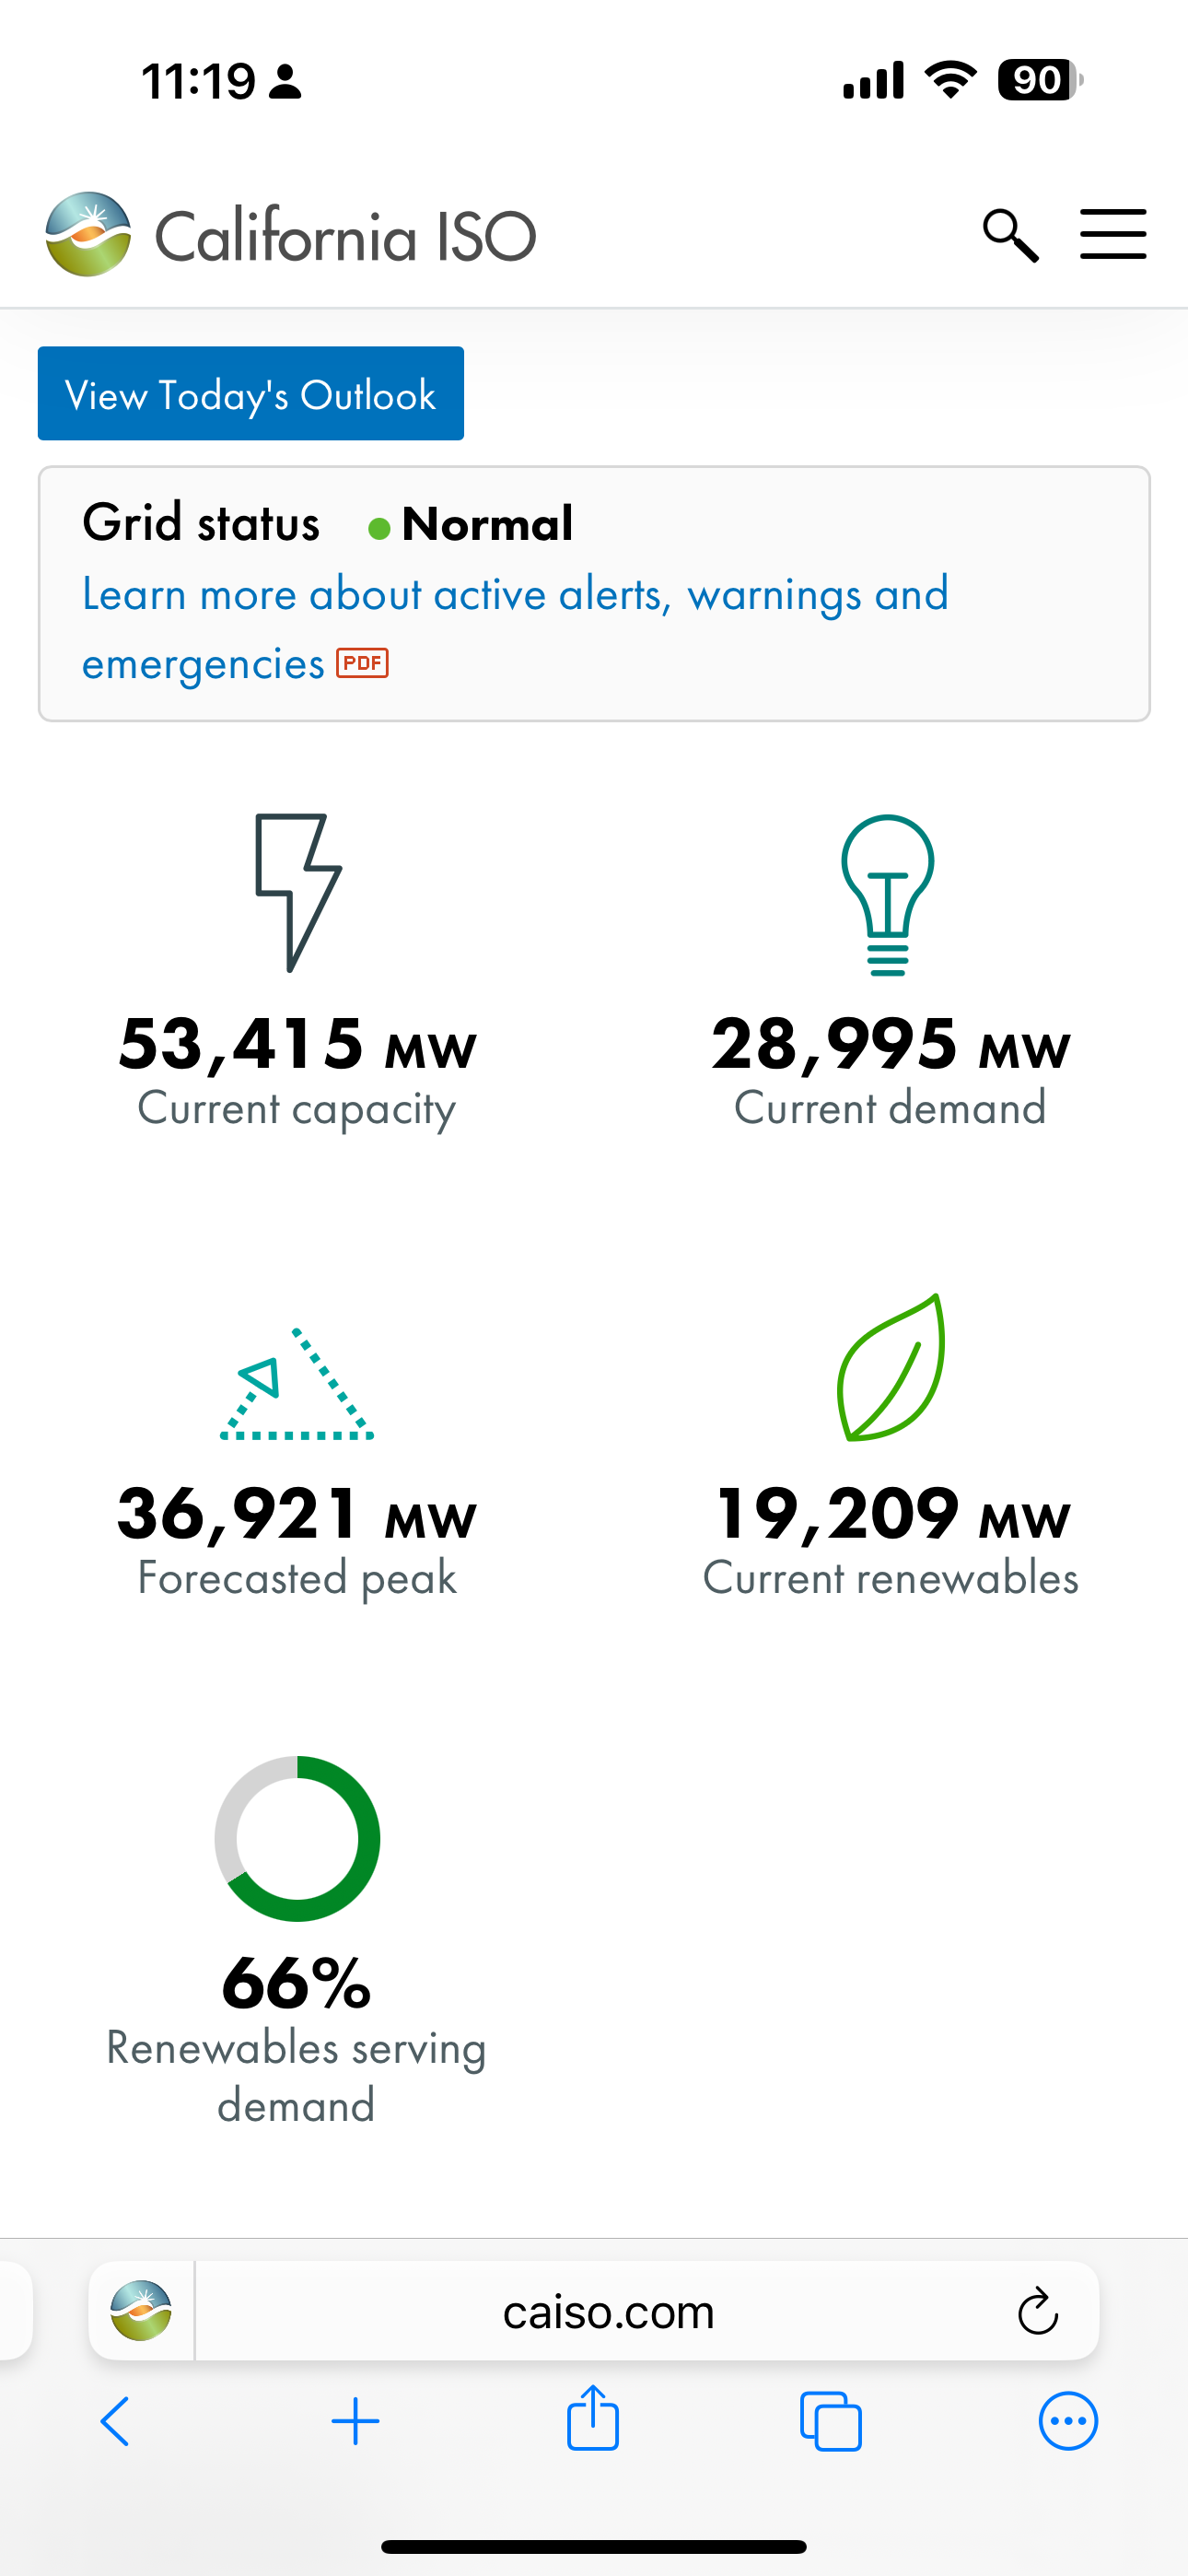
iirc they’re connected via DC not AC so they have “local” control over maintaining the 60hz frequency.
You can see live stats here.
that would actually make a lot more sense, it would also explain why they’re “separate” grids as well.
Genuinely surprised my region isn’t worse. It’s not great, but I fully expected it to look like Wyoming (but without the random little green bits).
Why did you cut off Maine?
It’s outsider art.
it’s insane that so many flyover states are competing (and winning) against fucking California
edit: by winning, i meant having more carbon emissions, not doing better. dumb wording.
People underestimate just how massive California is. There are a lot of people across a large span of land that require electricity. I imagine the map would look very different if it was scaled by population.
my wording has failed me immensely. i would at least expect people to look at the map and realize what I’m actually trying to say but here we are. that is my point. California has like the population of all these states combined yet all of them are producing more carbon emissions. when i said “winning” i meant in amount of carbon emissions, meaning doing worse.
Are we looking at the same map? Looks like California is far less emissions heavy than the flyover states. High proportions of solar panel energy, too.
They are winning in producing emissions
that’s what I meant. bad wording.
California has huge tracts of land that get sunshine like 365 days per year.
so Nevada doesn’t get much sunshine?
Nevada spent all their sunshine on hookers and blow.
Makes sense when you realize 12% of Americans live in CA, vs somewhere like WY where 0.17% of Americans live.
what i meant was there producing more carbon emissions. you would expect more populous areas to produce more carbon emissions
lol because it’s individual countries vs states in a nation?
What a lousy comparison.
Right above the US are much greener provinces which also aren’t individual countries.
and are also vastly less populated, the majority of Canadians are coastal.


